Image Source – https://venngage.com/
In today’s diversified and intricate business environment, the one-size-fits-all approach rarely cuts it. Especially when it comes to understanding and depicting the structure of a company, the traditional hierarchical model often falls short of capturing the nuances of modern businesses.
This is where the significance of an adaptive organizational chart comes into play. With the help of an organizational chart maker, companies can now tailor their charts to better align with their unique business models and operational nuances. In this article, we will dive deep into various types of organizational charts that cater to diverse business models.
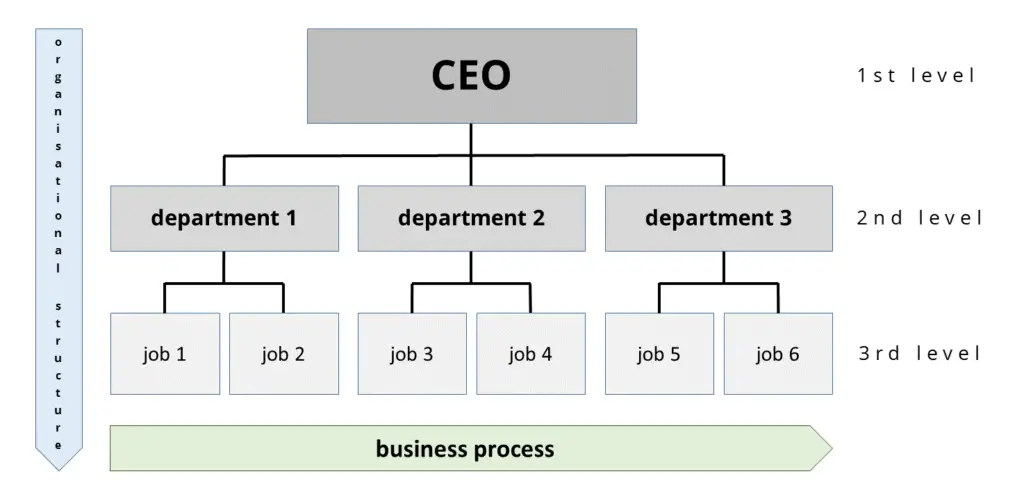
1. Hierarchical/Traditional Organizational Chart:
This is perhaps the most well-known type. It displays the structure based on rank, beginning with the topmost leadership level, usually the CEO or owner, and then branching out to subordinates in a top-down fashion.
Advantages:
- Clear authority and responsibility delineations.
- Easy to understand for employees at all levels.
Drawbacks:
- Can promote a siloed approach to work.
- May inhibit inter-departmental communication.
2. Flat Organizational Chart:
More prevalent in startups and smaller businesses, this model has fewer hierarchical levels, emphasizing horizontal structures and team collaboration.
Advantages:
- Promotes a sense of equality among team members.
- Facilitates faster decision-making.
Drawbacks:
- Can create ambiguity in role definitions.
- May lead to oversight in management roles as the company grows.
3. Matrix Organizational Chart:
This type is more dynamic and can be more complicated to create, this is when the use of an organizational chart maker can truly be utilized. It’s often seen in businesses that require employees to report to multiple leaders or serve in various roles across different projects.
Advantages:
- Offers flexibility in team structures.
- Encourages cross-functional collaboration and teamwork.
Drawbacks:
- Can lead to confusion about reporting relationships.
- Potential for conflicts due to dual reporting.
4. Divisional Organizational Chart:
Used by larger corporations that operate in diverse markets or have various product lines. This type segregates the organization based on products, projects, or geographical locations.
Advantages:
- Offers clarity in managing diverse business units.
- Tailored strategies for different divisions.
Drawbacks:
- Can result in duplication of resources across divisions.
- Possible lack of standardization.
5. Team-Based Organizational Chart:
Instead of a strict hierarchical structure, businesses that adopt this model emphasize team formations based on projects or functions.
Advantages:
- Enhances adaptability and responsiveness.
- Encourages skill development across diverse projects.
Drawbacks:
- Short-term focus might overlook long-term strategic goals.
- Potential for resource allocation challenges.
6. Network Organizational Chart:
This is a modern model, especially prevalent in the gig economy. Companies operate as hubs and liaise with external teams or consultants who are not permanent employees.
Advantages:
- Provides great flexibility and scalability.
- Reduces fixed overheads.
Drawbacks:
- Less control over external entities.
- Can lead to issues related to loyalty and company culture.
7. Circular Organizational Chart:
A visually intriguing model, where roles and responsibilities are depicted in a circle, with the core leadership in the center, radiating outward based on hierarchy or function.
Advantages:
- Promotes a holistic view of the company.
- Emphasizes unity and equality.
Drawbacks:
- Might be difficult to interpret for those used to traditional models.
- Limited in displaying intricate hierarchical levels.
Making The Right Choice:
While the variety offers flexibility, choosing the right organizational chart is crucial. Here are a few considerations:
Size of the Organization: Smaller teams might benefit from flat or team-based structures, while larger entities might need divisional or matrix models.
Nature of Business: A tech startup with a project-based focus might opt for a matrix or team-based chart, while a multinational corporation with varied product lines might choose a divisional structure.
Company Culture: A business that values inclusivity and equality might lean towards flat or circular charts, while traditional businesses might prefer hierarchical structures.
The Role of Technology in Crafting Modern Organizational Charts:
While understanding the different types of organizational charts is essential, the process of creating these charts has also undergone significant evolution. With advancements in technology, creating intricate organizational structures has become more streamlined, efficient, and user-friendly.
Embracing Digital Solutions:
Modern businesses are transitioning from hand-drawn or basic software-created organizational charts to more advanced digital solutions. An organizational chart maker offers a myriad of tools and templates, making the process not only efficient but also more collaborative.
Collaboration in Real-Time:
Gone are the days when changes to the organizational structure were communicated through memos or periodic meetings. Modern chart-making tools allow for real-time updates, ensuring that team members across various levels and departments are always in the loop about structural changes.
Scalability and Flexibility:
With digital tools, scalability becomes seamless. Whether it’s adding a new department, integrating a recently acquired company, or making interim changes to teams, digital organizational charts can be updated with just a few clicks, ensuring they reflect the most up-to-date company structure.
Integration Capabilities:
Many advanced organizational chart makers integrate with other business tools like HR software, CRM systems, and project management platforms. This integration ensures that data flow is consistent and that any changes in one platform can be automatically reflected in the organizational chart.
The Future of Organizational Charts:
The business world is in constant flux. With the rise of remote working, gig economies, and ever-evolving corporate structures, the future of organizational charts looks both promising and dynamic.
AI-Powered Predictive Structures:
As artificial intelligence continues to make strides in business operations, we may soon see AI-powered organizational charts that can predict future structural changes based on company performance, market trends, and strategic decisions.
More Emphasis on Roles than Titles:
With the evolving corporate landscape, the focus might shift from titles and hierarchies to roles and responsibilities. This will promote a more skills-centric approach rather than a title-centric one.
Increased Interactivity:
Future organizational charts might not be static visuals but interactive platforms. Employees could click on a department to get a deep dive into its function, key projects, and even KPIs.
Wrapping up:
Organizational charts, once a mere reflection of company hierarchy, are evolving into dynamic tools that offer insights, facilitate communication, and enhance operational efficiency. As businesses navigate the challenges of modern-day operations, embracing the right organizational model, backed by advanced tools and a forward-looking approach, will be crucial. It’s not just about understanding where each cog fits in the machinery but ensuring that the machinery adapts, grows, and thrives in a competitive landscape.