Introduction
Cryptocurrency trading is fast-paced, volatile, and often unpredictable. For traders, the ability to read and anticipate price movements is crucial. One of the most widely used tools in this regard is candlestick charting. Originally developed in 18th-century Japan for analyzing rice markets, candlestick patterns have since become a universal method for traders across all financial markets—including crypto.
In the world of digital assets, where Bitcoin and altcoins can experience 10% or more price swings in a single day, candlestick patterns provide valuable insights into market sentiment, momentum, and potential reversals. They allow traders to visualize the psychology of buyers and sellers, helping them decide when to enter or exit a trade.
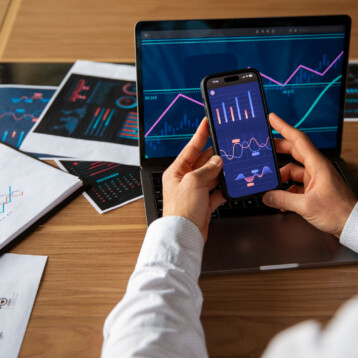
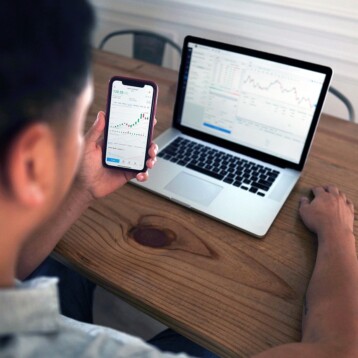
With the rise of advanced trading platforms, artificial intelligence has further enhanced candlestick analysis. Tools such as quantum ai now integrate predictive algorithms to identify patterns in real time, enabling traders to act with more precision. This article will explore the basics of candlestick patterns, highlight the most important formations, weigh their pros and cons, and analyze real-world examples of their effectiveness.
What Are Candlestick Patterns?
Definition
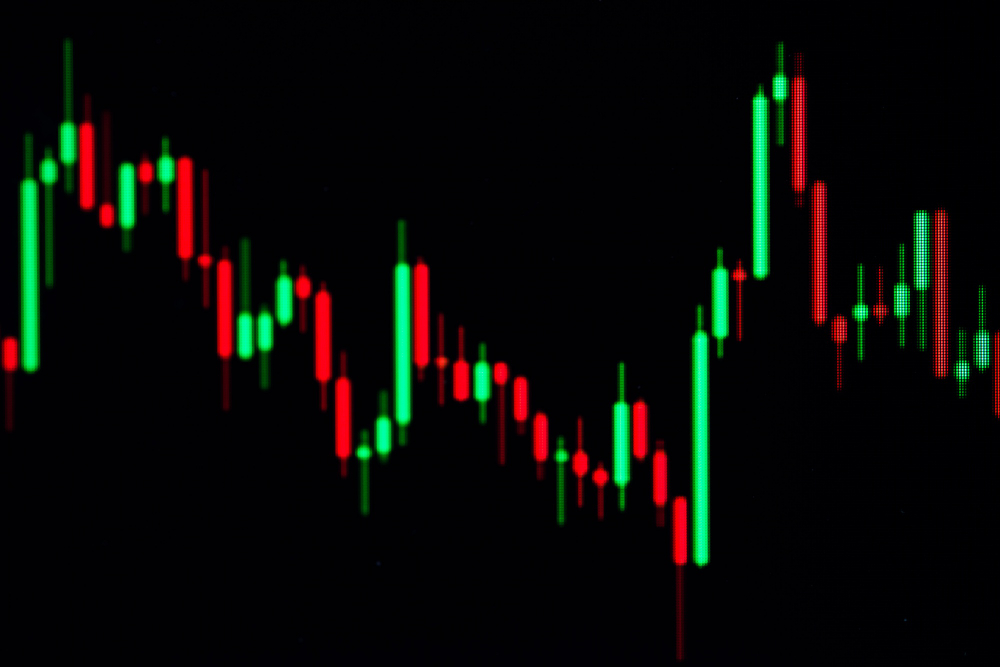
Candlestick patterns are visual representations of price action over a specific time frame. Each candlestick displays four critical data points:
- Open price
- Close price
- High price
- Low price
The body of the candle shows the range between open and close, while the “wicks” (or shadows) show the highest and lowest prices during that period.
Importance in Crypto Trading
- Helps identify bullish and bearish trends.
- Reveals market psychology at key moments.
- Serves as the foundation for technical analysis strategies.
Key Candlestick Patterns in Crypto
Bullish Patterns
- Hammer: A small body with a long lower wick, often signaling a reversal from bearish to bullish momentum.
- Morning Star: A three-candle pattern suggesting the end of a downtrend and the start of an uptrend.
- Bullish Engulfing: A larger bullish candle completely engulfs the previous bearish candle, showing strong buying power.
Bearish Patterns
- Shooting Star: A small body with a long upper wick, often indicating the end of an uptrend.
- Evening Star: The bearish counterpart of the morning star, signaling a downtrend reversal.
- Bearish Engulfing: A strong bearish candle swallows the prior bullish candle, suggesting sellers are in control.
Continuation Patterns
- Doji: A candle with almost equal open and close, reflecting indecision and possible continuation.
- Three White Soldiers: Three consecutive bullish candles indicating a strong ongoing uptrend.
- Falling Three Methods: A bearish continuation pattern within a downtrend.
Pros and Cons of Candlestick Patterns
Pros
- Easy to read and visually intuitive.
- Works across multiple time frames.
- Reveals market sentiment clearly.
- Can be combined with indicators (RSI, MACD) for accuracy.
Cons
- Not always reliable in isolation.
- Requires practice to identify patterns correctly.
- False signals are common in highly volatile crypto markets.
- Best used alongside risk management tools.
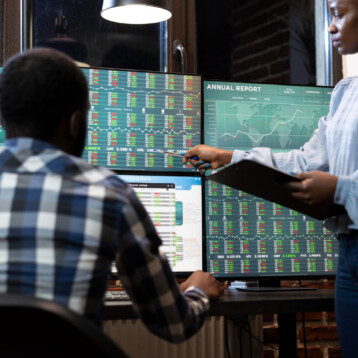
Case Studies in Crypto Candlestick Trading
- Bitcoin 2020 Rally: Before Bitcoin surged from $10,000 to $20,000 in late 2020, multiple bullish engulfing patterns appeared on the daily charts, signaling accumulation by large buyers.
- Ethereum Crash of May 2021: A series of shooting stars and evening stars signaled exhaustion of the uptrend before ETH dropped nearly 50% in weeks. Traders who recognized these patterns were able to secure profits or minimize losses.
- Scalping with Patterns: Intraday traders often use hammers and dojis on shorter time frames (5-minute or 15-minute charts) to capture rapid price movements. Platforms leveraging AI, like quantum ai, can automate recognition of these rapid signals.
How Traders Use Candlestick Patterns in Strategies
Swing Trading
Patterns like morning stars or three white soldiers are used to identify longer-term momentum shifts.
Scalping
Short-timeframe patterns like hammers or dojis are useful for quick entry and exit.
Risk Management
Patterns help traders set more accurate stop-loss and take-profit levels.
Confirmation with Indicators
Patterns are stronger when confirmed with indicators such as moving averages or volume analysis.
Conclusion
Candlestick patterns are a timeless tool that remain highly relevant in today’s cryptocurrency markets. They offer traders a window into market psychology, helping identify when buyers or sellers dominate. While no pattern is foolproof, combining them with technical indicators and risk management strategies significantly improves decision-making.
As markets evolve, the integration of artificial intelligence adds new dimensions to candlestick analysis. Platforms like quantum ai are at the forefront of this shift, offering real-time pattern recognition and predictive analytics that empower traders to act decisively in volatile markets.
Ultimately, whether you are a beginner or an experienced trader, mastering candlestick patterns can provide a crucial edge. By blending traditional chart analysis with modern tools, traders can build strategies that balance opportunity with caution in the fast-moving world of cryptocurrency.
Frequently Asked Questions (FAQ)
What are candlestick patterns?
They are charting methods that display price action using candles showing open, close, high, and low prices.
Why are candlestick patterns important in crypto?
They help traders interpret market sentiment and predict potential price movements.
Which patterns are best for beginners?
Simple patterns like hammers, dojis, and engulfing patterns are easy to recognize and highly useful.
Can candlestick patterns predict the market with 100% accuracy?
No, they should always be combined with other indicators and risk management strategies.
Are candlestick patterns effective in volatile crypto markets?
Yes, but volatility can also create false signals, so confirmation tools are essential.
How can I learn to read candlestick charts?
By practicing regularly on demo accounts and studying historical crypto charts.
Do professional traders rely solely on candlestick patterns?
No, they combine candlestick analysis with indicators, market sentiment, and fundamental analysis.
Can candlestick patterns be automated?
Yes, many bots and AI platforms can automatically detect and act on patterns.
Are candlestick patterns useful for both short and long-term trading?
Absolutely—they work across timeframes, from intraday scalping to long-term swing trading.
How can AI tools like quantum ai improve candlestick trading?
They provide real-time pattern recognition, predictive analytics, and automated execution, reducing human error and improving precision.