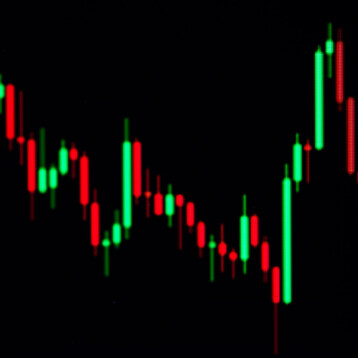
Introduction to Heatmaps in Trading
The world of trading is complex, with myriad strategies and tools designed to help traders make informed decisions. Among these tools, heatmaps have emerged as a popular choice for visualizing market data in a way that highlights areas of interest and potential trading opportunities. This guide aims to demystify heatmaps, providing traders with the knowledge necessary to leverage this powerful tool effectively.
Heatmaps display market data in a graphical format, using color gradients to represent various metrics such as price levels, volume, or liquidity. By offering a visual representation of market activity, heatmaps enable traders to quickly identify trends, patterns, and anomalies that might not be evident through traditional charts.
For a broader market perspective, using a crypto heatmap can help traders quickly identify which digital assets are gaining momentum and which are losing strength.
Understanding Market Depth
Before delving into how to read a heatmap, it’s essential to comprehend the concept of market depth, which is integral to the data displayed on heatmaps. Market depth refers to the volume of buy and sell orders for an asset at different price levels. It provides insight into the supply and demand dynamics within the market.
Market depth is typically illustrated through an order book, showing bids (buy orders) and asks (sell orders) at various prices. A heatmap takes this data further by transforming it into a visual format that can be analyzed at a glance.
Key Components of a Heatmap
Order Book Levels
The core component of a heatmap is the order book levels, which are represented by different color intensities on the chart. Each level corresponds to a specific price point where traders have placed buy or sell orders.
Liquidity Visualization
One of the primary functions of a heatmap is to visualize liquidity within the market. Liquidity refers to the ease with which an asset can be bought or sold without affecting its price significantly. On a heatmap, areas with high liquidity are often depicted with brighter or more intense colors.
Price Movement Indicators
Heatmaps also track price movements over time, allowing traders to see how prices fluctuate in relation to liquidity changes. This dynamic representation helps traders anticipate potential shifts in market trends.
Interpreting Color Intensity and Patterns
Color intensity on a heatmap is key to understanding market activity:
- Brighter Colors: Indicate high levels of interest or liquidity at specific price points.
- Darker Colors: Suggest lower liquidity or less interest from traders.
- Patterns formed by these colors offer clues about market sentiment:
- Consolidation Areas: Clusters of intense color might indicate areas where prices are consolidating before a breakout.
- Breakout Signals: Sudden changes in color intensity may signal potential breakouts or breakdowns.
Identifying Support and Resistance Levels
Support and resistance levels are critical concepts in trading that can be effectively identified using heatmaps:
Support Levels
Support levels are price points where demand is strong enough to prevent prices from falling further. On a heatmap, these levels appear as horizontal bands with significant buying interest (brighter colors).
Resistance Levels
Conversely, resistance levels are where selling pressure prevents prices from rising further. They appear as horizontal bands with significant selling interest on the heatmap.
By observing how prices interact with these levels on the heatmap, traders can make educated guesses about future price movements.
Utilizing Heatmaps for Day Trading
Day traders often rely on real-time data to make quick decisions. Heatmaps provide an edge by:
- Highlighting immediate changes in order flow.
- Identifying optimal entry and exit points based on liquidity.
- Offering insights into short-term support and resistance levels.
For instance, if a trader notices increasing color intensity at a particular price point during trading hours, they may interpret this as heightened interest and prepare for potential volatility.
Integrating Heatmap Analysis with Other Tools
While powerful on their own, heatmaps yield better results when combined with other analytical tools:
- Technical Indicators: Using indicators like moving averages alongside heatmaps can confirm trends.
- Volume Analysis: Correlating heatmap data with volume spikes offers insights into genuine market movements versus false signals.
- Sentiment Analysis: Complementing heatmaps with news sentiment analysis helps contextualize market behavior.
By integrating multiple tools, traders enhance their decision-making process, reducing reliance on any single metric.
Real-World Examples of Heatmap Usage
To illustrate practical applications, consider the platform Bookmap, known for its sophisticated heatmap functionalities:
– During volatile earnings announcements, Bookmap’s heatmaps highlight rapid changes in liquidity and order flow.
– In commodities trading, where geopolitical events impact prices significantly, heatmaps reveal shifts in trader sentiment as news unfolds.
These examples underscore how critical events are reflected instantly on heatmaps, allowing proactive rather than reactive trading approaches.
Common Mistakes and How to Avoid Them
Despite their utility, traders must be wary of common errors when interpreting heatmaps:
1. Over-reliance: Assuming that bright colors guarantee successful trades can lead to complacency.
2. Ignoring Context: Failing to consider external factors like economic news diminishes the accuracy of predictions based solely on heatmaps.
3. Short-term Bias: Focusing exclusively on short-term patterns without considering long-term trends may result in missed opportunities or misguided trades.
Avoiding these pitfalls involves maintaining a balanced perspective that incorporates both technical analysis and broader market awareness.
Advanced Strategies for Experienced Traders
For seasoned traders looking to refine their strategies:
- Algorithmic Trading Integration: Incorporate heatmap data into algorithmic models for automated trading systems.
- Cross-market Analysis: Compare heatmaps across related assets (e.g., currency pairs) to identify arbitrage opportunities.
- Predictive Modeling: Develop predictive models using historical heatmap patterns combined with machine learning techniques.
These advanced tactics leverage the full potential of heatmaps while pushing beyond conventional applications towards innovative trading methodologies.
By mastering how to read and interpret heatmaps effectively, traders unlock deeper insights into market mechanics – empowering them not only to react swiftly but anticipate future developments confidently. As technology continues evolving within financial markets globally, those adept at utilizing cutting-edge tools like heatmaps will remain well-positioned amidst ever-changing landscapes characterized by both challenges & opportunities alike!